Social media is the kind of thing you never really master: As soon as you get a handle on a good strategy, something changes, matures, or otherwise morphs into new must-haves and can’t-forgets. We like to think of it as an ongoing challenge and opportunity to learn. Or something like that.
One thing that hasn’t changed, though? Facebook marketing has long been – and will long continue to be – an integral piece of your social media marketing. Of course, there’s no one fix-it-and-forget-it Facebook strategy. The platform may be the granddaddy of social, but it’s also innovative. The more things change, the more things stay the same. Or so they say.
What we mean is, everything you learned last year could be wrong (or not-quite-right) this year. You have to stay current. Cue this post. Congrats! You’re already well on your way to knowing what you need to know about Facebook marketing in 2019. So, enough about that and let’s get on with the stats:
- Facebook user demographics & behavior statistics
- Facebook usage statistics
- Facebook marketing & advertising statistics
- Facebook photo & video statistics
- Facebook engagement statistics
Facebook user demographics & behavior statistics

Before you can market to your best advantage on Facebook, you must understand your Facebook audience: where does your demographic live on the platform, how do they use Facebook, and what are their favorite types of engagement? You’ll have to dig down a bit to discover your own specific stats, but these will give you a place to start:
1. A whopping 1.1 billion Facebook users speak English. That means that about half speak English, while the other half is divided over 100 other languages. Second place goes to Spanish (310 million users) and Indonesian (170 million), with Arabic and Portuguese sliding into a shared third (150 million users, each).
2. But, the Facebook world is much larger than the U.S. (or even English speakers). Because, while 68% of Americans are on Facebook, their numbers account for just 10% of the total Facebook population: At 190 million users, they’re in second place, behind India (260 million) and ahead of Brazil (120 million), Indonesia (120 million), and Mexico (79 million).
3. All that qualified, more than two-thirds of Americans use Facebook. Officially, the number is 68%, which means that Facebook is still your marketing platform to reach the greatest audience, if your audience lives in the United States. (Comparatively, just over one-third of Americans use Instagram.) If you serve a world market, know that more than 30% of the world (2.375 million people) uses Facebook.
4. And, even if an Internet user doesn’t use Facebook, they’re likely to live with someone who does. Officially, the number is half: half of non-Facebook users live with a Facebook user. What’s more, nearly one-quarterof people who “don’t have a Facebook account” actually use someone else’s account.
5. But, only half of U.S. teenagers use Facebook. It’s a notable (and curious) dropfrom a half-decade ago, when nearly three-quarters of American teens were on the platform. Among adolescents in the U.S. the new social platform kings are YouTube, Instagram, and Snapchat.
6. That said, about one-third of Facebook’s ad audience is <25. In other words, young Facebook users view ads somewhat disproportionately to their demographic representation:28% of Facebook’s ad audience is in the <25 set. A full 31% of the platform’s ad audience falls into the 25-35 age category.
7. Men aged 25-34 are the largest demographic group on Facebook. Men aged 18-24 fall in second place and women aged 25-34 are a close(ish) third. All that to say, it’s important to know your audience demographics, so you know how many of them are on Facebook and can determine how much of your marketing budget you should invest on Facebook. For example, if you’re targeting men 65+ (only 1.9% are represented on Facebook), you may want to consider spending a smaller percentage of your budget on Facebook and diversifying your advertising channels.
8. Older Americans are also on Facebook. In fact, the number of Facebook users aged 65+ and located in the United States, has doubled from 20% (2012) to 41% (2018). It’s not just the young’uns anymore!
9. And, older generations have a longer attention span. We know – shocker! But, okay, all generational stereotypes aside, the stats show that Facebook users aged 18-24 expend just 75% of the attention on video that their 65+ counterparts do. Consider your audience, as you create mobile video.
10. Sorry to say, but there are a ton of fake Facebook profiles. In the first quarter of 2018, Facebook stated that approximately 3-4% of all monthly active user profiles are fake. But, even without the fake users, Facebook still has a huge market share.
11. The good news is, Facebook is toiling to remove those fake accounts. In just the first quarter of 2018, the platform wiped 583 million fake accounts, working towards a goal of greater accountability and authenticity. As far as your marketing goes, know that your genuine brand and Facebook ads will now compete with fewer spam accounts.
12. Facebook is for families. 83% of parents are Facebook friends with their kids. And, while that stat may not mean anything on its own, it shows that multigenerational content has a place on Facebook. Kids share with their parents; parents share with their kids. You can even ask them to do so, given the right circumstances.
13. Even in 2019, Facebook is still growing at an astounding rate. More than a decade in, and Facebook is still seeing huge growth – roughly 6 new user profiles per secondand 500,000 new user profiles per day.
14. “Meaningful” Facebook Groups are also on the rise. In just one year, the number of people in meaningful Groups doubled to 200 million, supporting the platform’s 5-year goal of achieving 1 billion meaningful Group memberships. And, about that key word: “meaningful,” in Facebook terms, refers to a Group that makes up a key part of a user’s Facebook experience – and is therefore prioritized by the Facebook algorithm.
15. Did you know? Nearly half of Americans get their news on Facebook. Love it or hate it, the stats don’t lie: 43% of American Facebook users check the news on Facebook. That said, 57% of those users believe that social media news is inaccurate, in some way. The marketing takeaway here is clear: Connect with your audience, establish yourself as an authority in your field (through show, not tell), and stand out from the crowd. Show yourself to be authentic and accurate.
Facebook usage statistics

Beyond Facebook demographics, usage statistics can give you important insight into how the platform’s new priorities – transparency, authenticity, and “meaningful” interactions – affect and even shape your Facebook marketing strategy.
16. Facebook is now the world’s third most-visited website. That’s a decline, though. According to Alexa and SimilarWeb, YouTube unseated Facebook as the world’s #2 – right after Google, of course. While some experts point to Facebook’s mobile app-presence – the argument that many visitors tap Facebook via app, not the website – it bears mention that YouTube also has a popular app. Bottom line: Keep your eyes on both services.
17. Ranked by number of downloads, Facebook Messenger is the world’s most important app. What’s more, Facebook is the #1 mobile app. That is a lot of downloads, especially in a mobile-dominant market. If you haven’t already, shift your marketing to a mobile-first strategy. Oh, and P.S. – Facebook-owned WhatsApp takes the #3 position and Facebook-owned Instagram owns #5.
18. Two-thirds of Facebook users log in at least once a day. Once. A. Day. That is a lot of marketing power! In sheer numbers, nearly 1.5 billion people log into Facebook daily, while almost three-quarters of American Facebook users log in for their daily social fix; 50% of those daily active users check in more than once a day.
19. Nearly nine-tenths of Facebook users log on via mobile. In fact, the number currently hovers around 88% but, even more telling, smartphones and tablets account for around 95% of all Facebook visits. Again, for the marketers in the back – mobile-first content is a must!
20. The average American Facebook user spends nearly an hour on Facebook every day. (Officially, it’s 58 minutes but then, who’s counting?) Note that these stats are related to Android mobile app-users, but since 77% of the mobile world uses Android, it’s a pretty telling statistic. Facebook-owned Instagram nabbed second place with an average 53 minutes per day.
21. The average time on Facebook clocks in at 33 minutes. In other words, though the average daily time on the platform is nearly an hour, most users log in for short bursts– further supporting the multiple log-in statistic. Not to mention, a good reason to diversify your marketing strategy to support posting throughout the day.
Facebook marketing & advertising statistics

Okay, we’re going to assume you’re on board with Facebook marketing for business. But, here are a few more impressive stats that may convince you to start creating your Facebook ad now.
22. Small- and medium-sized businesses thrive on Facebook. You don’t need to be a Big Gun with a Bigger Budget to do well on social. In fact, Facebook reports an estimated 80 million small- and medium-sized Business Pages in 2018 – a 23% increase over the previous years. What’s more, about 7.5% of those businesses are advertisers, putting their social marketing dollars to good use.
23. Facebook’s revenue-per-user has doubled in just three years. In other words, Facebook’s user engagement is on the upswing, which drives (and boosts) revenue for the platform. In pure dollar terms, we’re talking $13.2 billion in revenue during the first quarter of 2018– a 42% increase over the previous year.
24. Facebook is THE place to market new products. A reported 78% of U.S. consumers have discovered a new retail product on Facebook. That’s nearly 8 out of every 10 users. Product discovery is mainstream and even expected, so get on board this train.
25. That’s part of the reason why Facebook is still the #1 platform for B2C and B2B businesses. Whether you market to consumers or other businesses, Facebook is the route to their eyes. If you want to dig down even further, 98% of socially savvy B2C businesses use Facebook, while 89% of their B2B counterparts do, as well. In comparison, B2C businesses report just 46% usage on LinkedIn.
26. On average, a Facebook user will click on 2 ads per week. The official stat points to about 11 ads per month, although you’ll want to know that it’s just 7 for men and 10 for women. In other words, if your primary audience is women, you’re in an even better position. All that said, this is a decline from early 2019, when Facebook reported an average click-through rate of 10 ads per month.
27. Marketers love Facebook for digital ad ROI. Google is still king [at 48%] but, among social sites, 30% of marketers report that Facebook nabs the highest digital ROI. To put that in perspective, YouTube and Instagram both squeaked by with just 4% of votes, while sad-faced Twitter took a paltry 2%.
28. As far as Facebook mobile ad revenue goes, it’s on the rise. In fact, between June 2017 and June 2018, the platform’s mobile ad revenue increased by 50%, which means that you should devote a good portion of your ad-spend to Facebook mobile ads.
29. Nearly one-quarter of all digital ad spend belongs to Facebook. Parent company Facebook – in other words, this includes Instagram – controlled nearly nine-tenths of all U.S. social media video ad spend in 2018, including 24.5% of worldwide digital video ad spend. That means that nearly one-quarter of all video ad dollars were funneled into Facebook and Instagram last year. Where did your budget go?
30. Speaking of Facebook ad spend, it’s on the affordable end. Around the world, marketers spend an average 20 times more on TV ads than they do on Facebook video ads. But – and here’s the kicker – that 20x increase nets just twice the viewership. In other words, Facebook ads afford greater bang for your buck over traditional video ad channels.
31. Still, prepare to spend an average $1.72 per Facebook ad click. You may not be able to buy a bucket-load of clicks for $5 anymore, but you can get a handle on average cost per click (CPC) for Facebook ads in your industry. And that’s important, if you want to be sure you’re not overpaying or overspending.
32. And – heads up! The price of ads is climbing. In the second quarter of 2018, the average price-per-ad increased 17%. The good news: Forrester’s analysis states that this rate of growth isn’t sustainable and will level off when supply/demand stabilizes. Even so, keep your eye on your social ad spending.
33. You can expect a 0.15% monthly change in Page likes. This is probably not something you want to hear but hey, with great power comes great saturation. The Facebook Page marketplace is saturated and their algorithm knows it; you’re not likely to see much greater than 0.15% monthly increase, unless you’re working other marketing channels and methods to increase your Page likes.
34. Ad impressions are also on the rise. Specifically, they increased 21% in a year, mostly due to an uptick in the frequency of Facebook feed ads. The takeaway here is, organic reach may be down but paid reach is increasing, so be sure to create relevant and engaging Facebook ads.
35. Nearly one-quarter of all Facebook Pages use some type of paid media. And it’s not just because of reach: Over 24% of Facebook Pages pay for reach AND the added function of boosted posts, including the oh-so-valuable audience targeting and lead generation. Of course, as we already mentioned, the more marketers avail themselves of paid media, the more saturated (and, therefore, more competitive and pricey) the market will become.
36. As an overall trend, e-commerce is growing. In fact, e-commerce click-through rates have tripled in just two years, and this statistic extends to Facebook users actively seeking to purchase something: Take note! They are now more willing to purchase than they ever were.
Facebook photo & video statistics
Did Facebook video kill the photo star? Only these stats will tell.
37. Today, people love video even more than they did yesterday. And by that, we mean that a reported 71% of users have increased how much they watch on Facebook – and that’s just in a year’s time. What’s more, 60% expect that they’ll be watching more video next year than they have this year. Talk about an upward trend.
38. Mobile-optimized Facebook video is effective for brand awareness, too. TV video ads, which are often recycled due to budget considerations, reportedly lift brand awareness around 40%; Facebook video ads, on the other hand, run around a 67% lift in brand awareness. What’s more, message association – aka, being able to identify a brand’s message – among people who watch mobile-optimized Facebook video ads doubles to 41%.
39. And while we’re on the topic, video wins for introducing products. That’s because, 30% of all mobile shoppers prefer video over other mediums, when they discover new products. Unsurprisingly, younger generations skew even more in favor of video: millennials are a reported 1.35 times more likely to prefer video than boomers, for example.
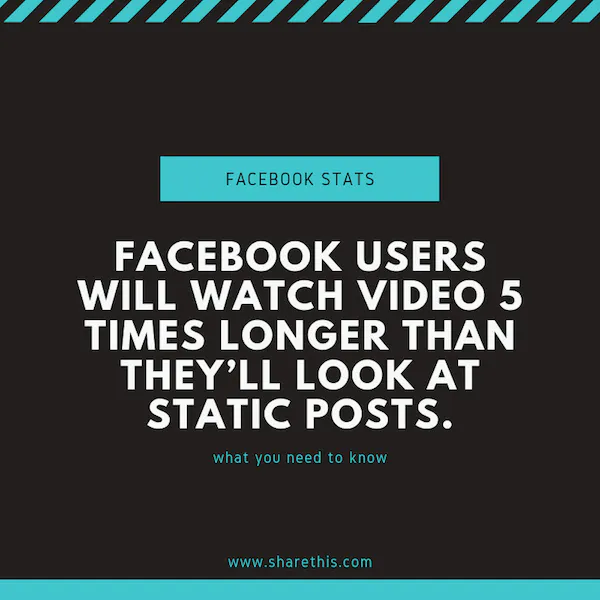
40. When people are in the mood for video, they’re in the mooood. The numbers don’t lie but what they do demonstrate is that, when Facebook users intentionally consume video, they’ll stick around five times longer for your videos than they would if they were just passing through. To put this into marketing terms, people using Facebook Watch will tolerate longer ads than those scrolling their newsfeed on desktop.
41. Video grabs more attention. We know – not a shocking statistic. But, consider that Facebook users will watch video 5 times longer than they’ll look at static posts. People simply like video.
42. Facebook video has the greatest engagement. Compared to standard status posts (2.21%), link posts (3.36%), and photo posts (4.81%), Facebook video post engagement hovers just over 6% – the highest engagement metric of any type of Facebook post.
43. Photos. Photos. Photos! Facebook users have a thing for photos, apparently. A thing to the tune of 250+ billion photos uploaded to the platform. What’s more, 350 million new photos are added every day. Bottom line: If you’re not uploading video, then consider photos. Facebook users seem to love ‘em.
Facebook engagement statistics

Ah, the Holy Grail of Facebook marketing: engagement. You know you want it. You fear your competitors have it. But, what’s the real deal behind Facebook engagement – and, how can you boost yours?
44. For as much time as Facebook users spend on the platform, they do more looking than engaging. Per month, the average user likes just 10 posts and makes only 4 comments – even though the average user is on Facebook nearly an hour a day.
45. That said, Facebook users are a likeable lot. They rack up a reported 4 million likes every minute, in fact. The takeaway here, at least in our opinion, is that if you see the forest and not the trees, there’s a lot of potential likes waiting for you.
46. Average Facebook post engagement hovers just under 4%. If engagement drives reach, and shares and comments are better engagement metrics than reactions and likes, then you know where we’re going: boost your engagement rate above the average 3.91% by tracking important benchmarks, incentivizing high-value engagement, and promoting posts that have higher-than-average engagement (they’re cheaper to promote, FYI).
47. Speaking of reach, you can expect an organic average reach of 6.4% of your Page likes. In other words, if you have 100 Page likes, you’ll net an average 6.4-user reach. Bump it up to 1,000 Page likes, and we’re talking a reach of 64 users. Bear in mind, we’re talking 6.4% of average organic reach; promoted posts can reach much higher than that. (Overall reach – combined organic and promoted, hovers around 8.1%.)
48. Facebook Stories are boss. There’s urgency in something that disappears, isn’t there? That’s part of the reason why 150 million users publish Facebook Stories– and why the platform has opened up Stories to ad publishing. So, while it’s familiar (thanks, Instagram and Snapchat), it’s also an emerging ad market. Hop aboard!
49. And if you think Facebook Stories are big, wait until you see Facebook Live broadcast stats. They’ve quadrupled in just a year. Everyone seems to love a livestream. That’s probably why Facebook Live videos can rack up an average six times more interactions than standard video. Early adopters will benefit but there’s not much time left for you to be considered “early,” so get on it!
50. While Facebook Messenger may be the #1 messaging app, only 31% of businesses are hip to its power. And that creates opportunity for you. Cut through the noise, invite person-to-person engagement, and join that nearly one-third of savvy businesses: enable Facebook Messenger for your business Page.
Now, it’s your turn: What’s the most shocking, or strategy-changing, or useful statistic on our list? What would you add?
If you want to boost engagement and get more FB followers, installing the Facebook share button is a simple, straightforward way for your visitors and readers to promote your content for you – making it easy for them to share to Facebook with just one click. It takes just minutes to install, so what are you waiting for?
If you’re looking for more information about Facebook marketing we have a series of guides on the site to answer questions like how to pin a post on FB?