Measure, measure, and measure some more. As a marketer, measuring data is critical to each campaign. When you test data, you learn what works, what doesn’t, and what could work with some tweaking.
A/B testing is a must for marketing campaigns. But how do you know if the results you get from split-testing are statistically significant? Quick reminder if it’s been a while since your last statistics class: Statistical significance determines if results happened because of specific factors or if they were mere coincidence.
One way to do it is to use a statistical significance calculator that shows you the differences between two marketing campaign results.
What Is a Statistical Significance Calculator?

A statistical significance calculator can be a simple or complex tool designed to help you determine if a change to your marketing campaign made a statistically significant difference in your result. The difference can be positive or negative.
For example, say you’ve created two versions of a landing page for one of your services. Page A and Page B are identical except for an updated call-to-action you placed on Page B. Page A had 2000 visitors and 90 conversions; Page B had 1500 visitors and 120 conversions.
Plug this information into a calculator, and you’ll see that Page A has a 5% conversion rate to Page B’s 8% conversion rate, giving Page B a 78% better conversion rate. A calculator notes that you can have 100% confidence that Page B will perform better than Page A based on these results.
You can run the same analysis on two different versions of a social media ad, two different versions of a blog post title, and just about any other elements of your marketing campaign to create a fully optimized campaign. If you’re well-versed in Google Analytics, you can conduct A/B tests in the platform to compare and analyze two or more variants of a web page to optimize your website.
How to Use a Statistical Significance Calculator
Each statistical significance calculator will work a bit differently, but most of them are relatively straightforward. To calculate statistical significance for A/B testing, you’ll need to focus on one metric that differs in the two versions of what you’re testing, like a paid advertisement or a landing page.
Using the landing page example above, you’re trying to determine if the call-to-action on Page A or Page B is getting better conversions. Keep all other metrics the same to test this accurately.
You’ll also need to make sure you’re using a specific sample size or length of time that’s the same for each version. For example, you might measure each page’s data for the same one-week period to get an accurate sample.
The Best Statistical Significance Calculators
Although you can calculate statistical significance on your own, it can be a lot quicker and easier to use a calculator to do it. Fortunately, you can find several free calculators online that can show you results in seconds.
Simplest Calculator: Neil Patel’s A/B Testing Significance Calculator

If simplicity is your priority, then Neil Patel’s calculator is an excellent option. You can compare data between your two versions or add more variations to the calculator. This calculator asks you for page traffic and overall conversions to give you a percentage and confidence rating for your results.
Best for Beginners: Convertize’s A/B Test Significance Calculator

This calculator from Convertize is another simple one to use if you don’t need a bunch of additional metrics and just want to focus on the basics. It’s similar to Neil Patel’s calculator, except that you can add a confidence level to show how statistically significant your results might be based on different confidence levels between 90% and 99%.
Easiest-to-Understand Calculator: Act-On Software’s Statistical Significance Calculator

Act-On’s statistical significance calculator features an easy-to-understand results confidence gauge with colors reminiscent of a traffic light ranging from “likely a fluke” (red) to “good for a rough sense” (yellow) to “this is a sure thing” (green). Results are calculated using the chi-squared statistical hypothesis test.
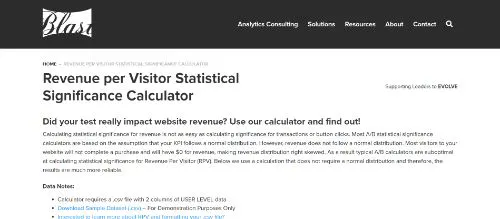
Best for Calculating Revenue Impact: Blast’s Revenue per Visitor Statistical Significance Calculator

If you’re focusing on the impact of your changes on your revenue per visitor, this calculator from Blast can help. You can upload a .CSV file with your data included for the calculator to share your results. We suggest downloading the sample dataset to play around with first and get an idea of how your data should look before uploading.
Best Visuals: Bayesian A/B Testing Calculator

The Bayesian A/B Testing Calculator stands above the rest for visual learners who understand more from graphs than text. Plug your data into the easy-to-use calculator, and the site will display graphs that include conversion rates, expected loss, and the probability of the best variation.
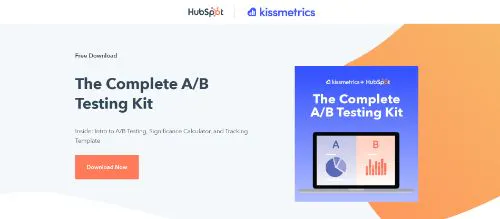
Best Excel-Based Calculator: The Complete A/B Testing Kit from HubSpot

HubSpot offers a free A/B testing kit when you sign up with your email address. Included in the kit is a statistical significance calculator that uses Microsoft Excel. As you plug in data, you can see your results change in real-time.
A statistical significance calculator can help you determine how confident you can be that your A/B test results are correct. Weave the calculator that works best for you into your overall marketing strategy to help you tweak your results.
Want to keep better tabs on your website’s performance? Install our Google Analytics Dashboard for WordPress plugin to get valuable website performance data like visitor trends, your 10 most-viewed pages, your top 5 traffic sources without leaving your WordPress dashboard.


