
by Wahid Charbakh, Principal Research Engineer
Measuring Ad effectiveness is very important in the field of display advertising. Effectiveness is usually measured based on a set of key metrics based on the advertisers goals and established industry standards. Publishers rely on these same metrics to evaluate their own inventory and decide on a pricing strategy. Some of the most used key metrics include Click-Through-Rate (CTR), Cost-Per-Action(CPA). A new metric has been introduced in the past couple of years is Viewability. In this article, we define Viewability and discuss how it relates to other key KPIs.
In short the Viewability metric was introduced to ensure Advertisers that their Ads are actually viewable when displayed on the user’s screen. This may sound rudimentary but it took the industry some time to establish a standard. There is however still much debate about the effectiveness of such standard. For example, the standard establishes that an Ad is viewable if 50% of it can be seen for at least one second with 50% probability. If this comes across like a fuzzy and somewhat arbitrary definition, then that’s because it is. The main reason for this is that measuring viewability relies on estimating both the location of the Ad in the viewable portion of browser’s canvas and estimating how long it stays there.
The main Viewability vendors such as IAS and ComScore try to estimate this using various techniques. Some of there techniques rely on a limited number human feedback. The rest relies on a combination of automatic methods to calculate the viewability scores. These methods only cover a subset of the web sites. The overall scores are interpreted as probabilities where higher scores mean higher chances of viewable Ads.
Viewablitity as discussed earlier seems to be a necessary tool to assure Advertisers that the reported impressions are actually viewed by users and are not mere renderings on non-viewable parts of some browser. However, this is necessary but not sufficient. An Ad could be viewable but it may not be on a good quality site. In this case, such impressions may hurt the Advertisers brand. For example, there are many spam sites that feature prominent positions for Ads. In this case, a good impression should not only have high viewability score but it also needs to be paired with a high measure of brand-safety. BrandSafety can be considered as an inventory filter for Viewability. Establishing a strict Brand-safety filter is possible when the inventory is largely high quality as such filters are usually very accurate. In addition, such filter will not reduce inventory significantly.
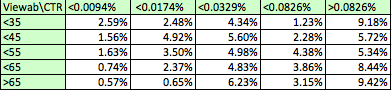
Another important metric is CTR which is considered to be the most important KPI for many advertisers. For CTR the most important measure is user clicks. It is self-evident a click is only valid if the Ad is actually also viewable. This does not necessarily mean, however, that high CTR can only come from high viewability sites. A minimum viewability score may be necessary but beyond that there is not much strong correlation between viewability and CTR.
An additional consideration is that a stringent constraint on viewability reduces inventory drastically. This is not desirable and can jeopardize an Ad campaign even though a higher CTR may be achieved.
The main risk with viewability is that it may be misunderstood by both advertisers and campaign managers. The main source of misunderstanding is that it might be hard to appreciate its probabilistic nature. Also it may be easy to overlook the fact that average inventory score may hover around 50%. Instead campaign managers respond to advertisers’ requests for high quality by bumping the viewability requirement to 70% and above. This may indeed improve viewability but jeopardize other more significant campaign goals.
In conclusion, viewability may at first be considered as intuitive and independent metric. However, its nature is subtle and its application requires careful consideration especially as other key KPI are considered. A careful analysis of how the various KPIs relate to each other and the available inventory is needed to develop a successful strategy. Such a multi-KPI optimization approach becomes necessary while its complexity increases as more KIPs are considered.