If you’re building split tests for anything from conversion optimization to tests for social media platforms (like A/B tests on Facebook) or SEO click-through rate optimization, it’s important to understand not only what to test (through things like a list of A/B testing examples), but how to measure whether your hypothesis was confirmed.
Part of that is knowing whether a statistical sample you’ve gathered for an A/B test is statistically significant. There are a variety of ways (including third-party statistical significance calculators) to get to this answer, but in this post we’ll walk through how to determine this specifically with Excel.
What is Statistical Significance?
Statistical significance is a concept used to determine the likelihood that a relationship observed between variables in a marketing campaign is genuine and not just a random occurrence.
In simpler terms, it helps marketers understand if their strategies have a real impact on key performance indicators (KPIs), such as:
- Conversions
- Click-through rates
- Or customer engagement
When analyzing campaign results, marketers often use statistical tests to compare data sets and identify patterns.
A p-value is obtained, which represents the probability of observing the results if there was no actual relationship between the variables.
A lower p-value (typically below 0.05) indicates stronger evidence of a significant relationship.
In a marketing context, achieving statistical significance ensures that decisions made on the basis of campaign data are more likely to yield positive outcomes and that the results can be confidently attributed to the strategies implemented rather than random chance.
Why is Statistical Significance Important?
Statistical significance can impact your company’s marketing and testing efforts in a number of ways, including:
- Validating marketing efforts: By determining if observed results are due to strategy implementation or chance, marketers can gauge the effectiveness of their campaigns.
- Guiding decision-making: Achieving statistical significance helps marketers make data-driven decisions with confidence, enabling them to allocate resources more efficiently and optimize their strategies.
- Minimizing risk: Understanding statistical significance reduces the likelihood of acting on false positives, which can lead to wasted time and resources on ineffective campaigns.
- Enhancing credibility: Demonstrating statistically significant results lends credibility to marketing claims, fostering trust among stakeholders and clients.
- Supporting continuous improvement: By identifying significant relationships between variables, marketers can refine their campaigns and drive better results over time.
How to Build Your Own Calculator in Excel
We’ll link to some pre-built Excel calculators below, but if you’re looking to build your own, here are some step-by-step instructions you can follow to build your own calculator:
Step 1: Set up your spreadsheet
Create a new Excel workbook and label two sheets as “Calculator” and “Data.”
In the “Calculator” sheet, create headers for “Variant A” and “Variant B,” along with labels for “Visitors,” “Conversions,” and “Conversion Rate.”
Step 2: Enter your data
In the “Data” sheet, record the number of visitors and conversions for each variant (A and B) of your test.
Create a formula in the “Calculator” sheet to calculate the conversion rate for both variants by dividing the number of conversions by the number of visitors.
Step 3: Calculate the standard error
In the “Calculator” sheet, create a formula to calculate the standard error for each variant using the formula: =SQRT((Conversion Rate*(1-Conversion Rate))/Visitors).
Step 4: Calculate the test statistic (Z-score)
Determine the Z-score by subtracting the conversion rate of Variant A from that of Variant B, and then dividing the result by the square root of the sum of the standard errors squared.
Step 5: Calculate the p-value
Use the =NORMSDIST() function in Excel to find the p-value associated with the Z-score calculated in Step 4. If the p-value is less than 0.05, the difference between the two variants is considered statistically significant.
FAQ #1: What Is the P-Value & Why is it Important for Statistical Significance?
A p-value is like a test score that tells us if something special is happening or if it’s just random. If the p-value is small (usually below 0.05), it means that the special thing we’re seeing is probably not just a coincidence, so we can trust the results more.
FAQ #2: What is the Z-score & Why is it Important for Statistical Significance?
A Z-score is like a measuring stick that tells us how far away something is from what’s normal or expected. It helps us figure out if the difference we see between two things is really special or just happened by chance. This helps us make better decisions based on what we learn.
Free Excel & Google Sheets A/B Statistical Significance Calculator

VWO offers a ready-made calculator that you can access here:
https://docs.google.com/spreadsheets/d/1QaTLG9UNF7L25BXqCWBvXx3auTniDb9IvF6KmUOB2B8/edit#gid=0
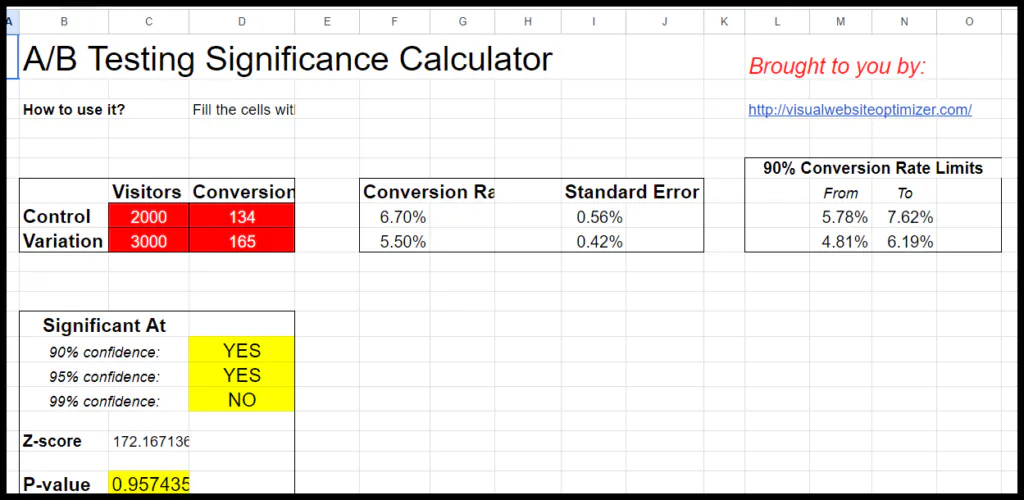
Unlike the DIY steps outlined above, the end result of this calculator will allow you to simply input the number of visitors and conversions for both the control and variation groups.
The calculator then automatically computes the significance, p-value, z-value, and other relevant metrics for your A/B tests, whether they’re related to ads, websites, or any other split tests.
Will These A/B Statistical Significance Calculators for Excel Work in Google Sheets?
Both the instructions for the DIY calculator and this VWO calculator will work in Google Sheets as well. The VWO calculator is available as a Google Sheets version at the link above. For the Google Sheets version, you need to make a copy of the sheet into your own Google account before you can edit it.
The Right Tools For The Right Jobs
One important element of A/B testing is making sure you have the right capabilities (testing software, design and development resources, etc.) for the tests you want to create.
If what you’re looking to optimize for in your A/B tests is increased social shares or site engagement, our free website tools might be the perfect A/B testing idea for your site.


