
Hidden behind the ups and downs of the COVID-19 pandemic, health issues in general have not disappeared. Whether people are looking for more info on seasonal allergies to serious chronic conditions, our data shows that internet users are searching for answers on how best to handle a wide range of health issues beyond COVID—and prescription accessibility is an issue involved in every health condition.
Health Topics Are Trending
Average Monthly Percent Growth in Category Engagement, October 2021 – March 2022 (%):
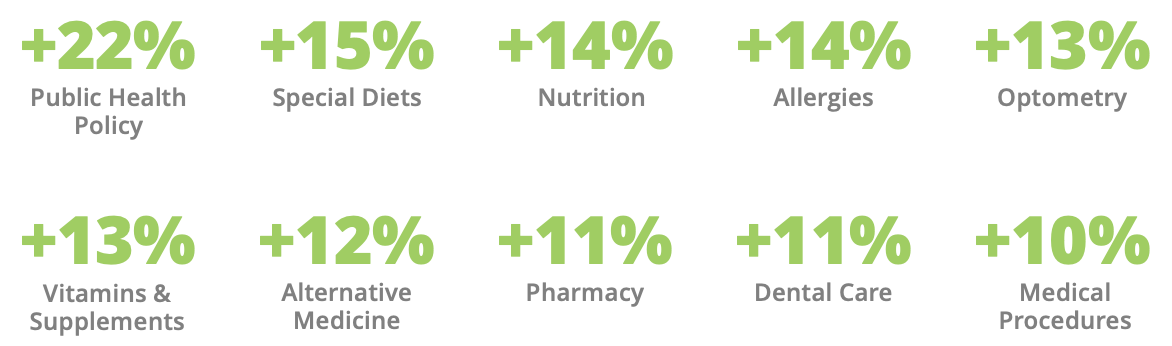
Interest in health categories is up across the board, with public health policy leading the pack as a top subject of concern. Despite a small lull in overall COVID case numbers, our data shows that users are very invested in learning how the government can assist with keeping them safe. Users are also interested in healthy living topics like supplements, healthy diets, nutrition, and alternative medicine.
Prescription Drug Costs Are a Top Concern
Most Discussed Medications From A Cost Perspective
Volume of Behavioral Signals Versus the Average:
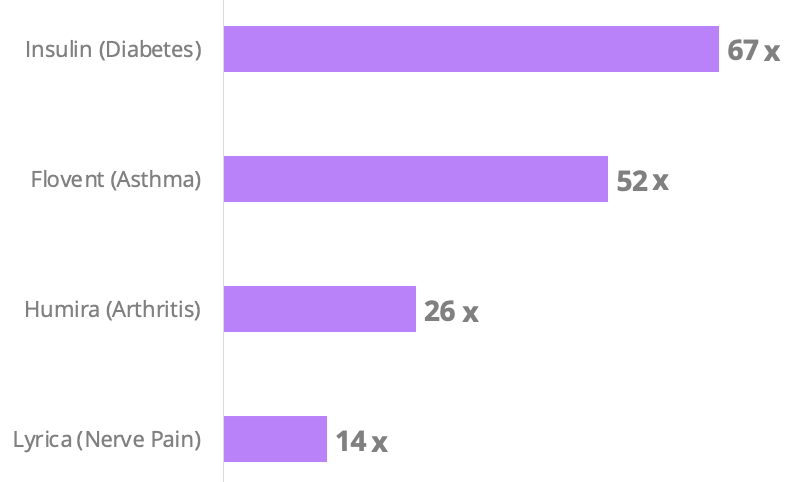
One of the areas of public health policy that most resonates with our ShareThis user base is prescription drug costs. Our data shows a 134% average monthly growth in interest in this topic, particularly around insulin costs, which have skyrocketed in recent years. President Biden’s proposal to cap insulin costs at $35 out-of-pocket has resonated throughout the United States, with eight states already passing legislation to enforce this policy. Insulin tops the list of most discussed medications from a cost perspective, with engagement signals at 67x higher than the average. Clearly, internet users are invested in the cost of their medications and what the government is doing to regulate those costs.
Health Issues Wax and Wane with the Seasons
Percent Share of Behavioral Signals by Week (%):
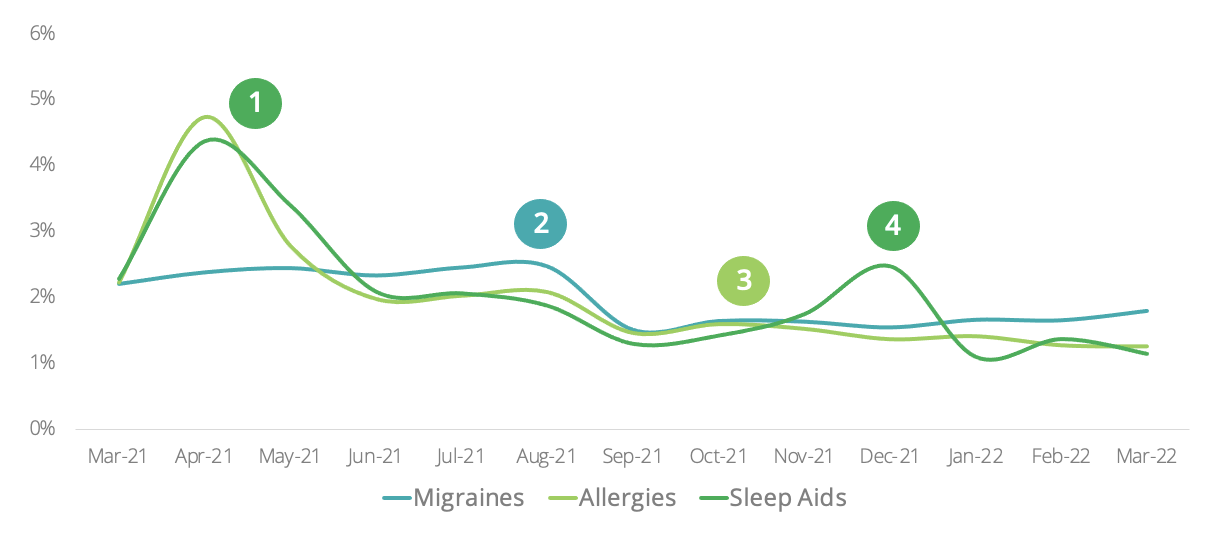
- Trouble sleeping and peak allergy season are related: it’s not easy to sleep well with a stuffy nose.
- Migraines appear to pick up with warmer and wetter weather.
- One possibility for why people love fall? Weather dries out and allergens recede.
- The holiday season can bring on sleep-affecting stress.
Complaints like migraines, allergies, and insomnia change throughout the cycle of the seasons. Our data shows that allergies and insomnia peak in the spring, suggesting that insomnia and spring allergies could be linked. And while allergy signals taper off through the summer and fall, searches about insomnia rise again around the holidays—perhaps as a sign of holiday stress. Migraine signals are highest during warm and wet weather, peaking in the late spring and summer.
Migraine Sufferers Appeal to Specialists for Help
Highest Indexing Categories by a Migraine Audience:
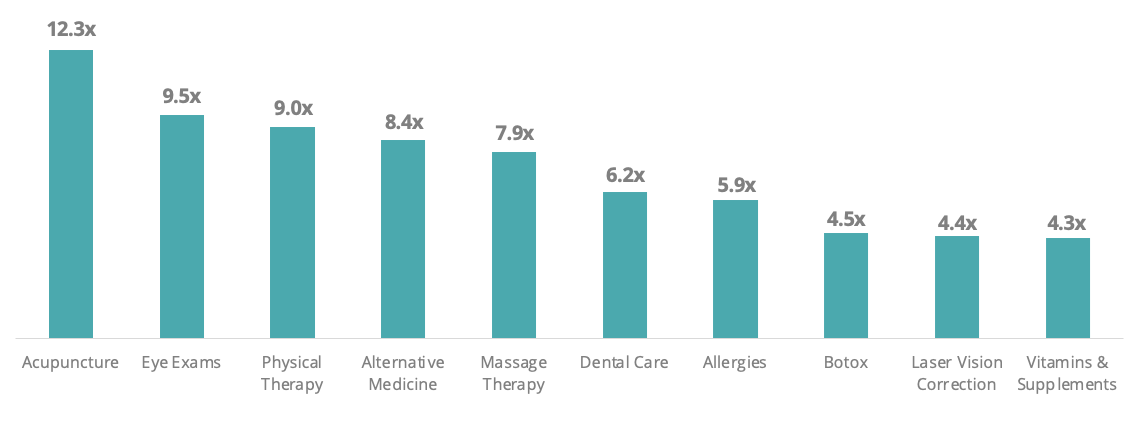
Our data shows a high interest in different specialized treatments among migraine sufferers. The topic of highest interest is acupuncture, with engagement 12.3x higher than the average. Migraine sufferers also search for other potential avenues of relief, exploring eye exams, physical therapy, and alternative medicine.
Allergies Could Be More Prevalent in Cities
Volume of Behavioral Signals Versus the Average:
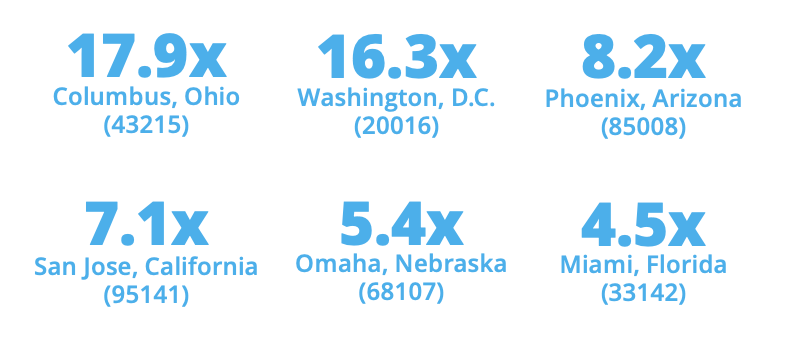
You might imagine that allergies would be worse in rural areas, where there are more plants and animals that could cause symptoms. However, our data shows a higher engagement with allergy-related behavioral signals in city zip codes. Columbus, Ohio led the results, at nearly 18x the average engagement, followed by Washington, D.C., at 16.3x the average.
Allergy Medication Brands’ Percent Share of Behavioral Signals (%):
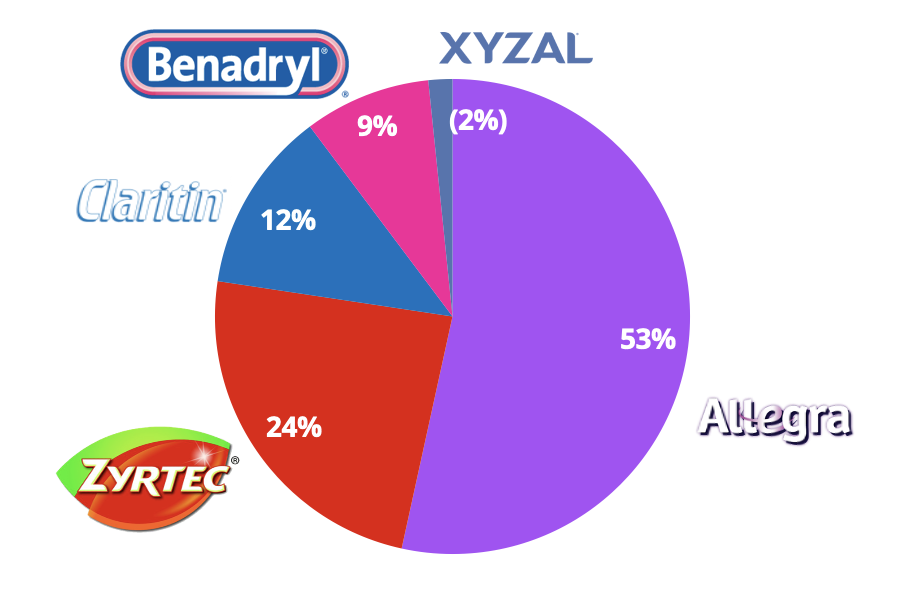
The majority of allergy medicine searches indicated a preference for Allegra, which had 53% of the engagement, more than double what the next highest medication, Zyrtec, showed at 24%.
Insomnia Sufferers Prefer Prescription Medication
Sleep Aid Brands’ Percent Share of Behavioral Signals (%):
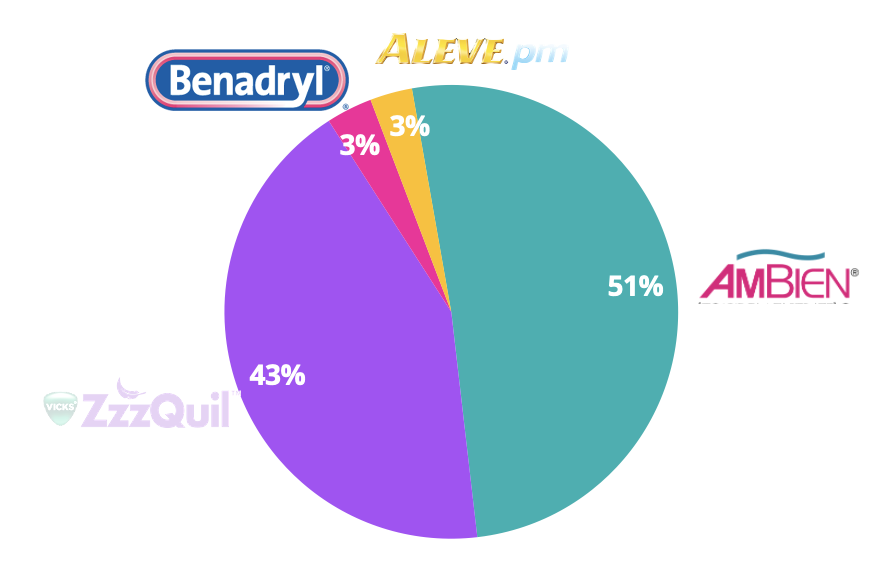
There are many different medications that can help with insomnia, from herbs to over-the-counter medications to prescriptions. Our audience who searched for sleep aids showed the most interest in the prescription drug Ambien at 51% of behavioral signals, followed by the over-the-counter drug ZzzQuil, which had 43% of signals.
Despite the high interest in prescription medication, those suffering from insomnia are also more likely to search meditation keywords, showing an interest in alternative health strategies as well. In the last 6 months, our data shows an 18% increase in meditation searches, peaking in January, when many of our audience are particularly invested in improving their health.
Conclusion
Health is an important topic for our audience, and they are interested in both pharmacological and alternative health treatments. Whether they are dealing with allergies, migraines, or insomnia, they are curious about solving their problems as well as how government regulation will affect public policies.
If you’re interested in learning more about data that can help you connect with your audience, contact us.