有比滿足你的流量來源報告的眼睛。
乍一看,它告訴你你的讀者來自哪裡。例如,它們可能來自 Twitter、Google 搜索或其他連結到您文章的出版物。該報告分解了前五個來源,如:

這些資訊是有益的,這已經不是什麼秘密了。當您瞭解頂級引用者時,您可以嘗試從這些來源驅動更多的流量。問題是:你是怎麼做的?如何使用這些資訊來優化您的分發策略並擴大讀者群?
讓我們來分解此報告中的三個隱藏教訓,以及您可以採取哪些步驟來驅動更多的流量。
1. 優化共享按鈕
您是否從 Facebook 驅動大量頁面流覽量, Pinterest , 還是推特?然後,是時候為受眾提供所需的工具,以在這些頻道上共用更多內容,並增加您的推薦流量。
您可以使用我們的新 共用按鈕設計工具.只需選擇您的社交管道, 自訂您的設計,並在您的網站上安裝按鈕。

也許你想使用內聯按鈕,比如 70% 發佈者 做。或者,也許你想包括行動呼籲,像60%的我們 發佈者 做。借助此可視化設計工具,只需單擊幾下即可實現。
現在,當有人閱讀您的內容時,他們不必三思而後行地考慮如何與朋友共享內容。而且,您可以憑藉流量激增獲得回報。
取得分享按鈕
2. 測試您的複本
不要只是發佈任何社交帖子,並希望人們將繼續點擊通過您的網站。您希望在性能最好的頻道上分享最吸引人的內容。謝天謝地,你可以確切地找出讀者想要什麼 A/B 測試 您的複本和圖像。
說 Facebook 是您最大的流量來源之一。您可以使用我們的 社交 A/B 工具 在幾分鐘內開始運行測試。只需選擇一篇文章,並輸入一些變體的標題,圖像,標題,或介紹副本。
也許你想看看讀者對問題或陳述的反應是否更好。您可以執行 A/B 測試,其方法為:
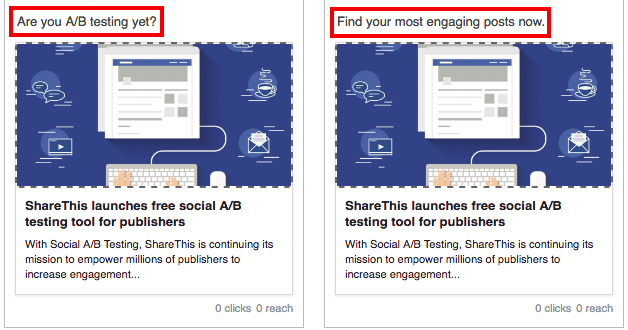
然後,我們將在年齡目標受眾之間拆分差異-一半將看到第一個帖子,一半將看到第二個帖子。一旦我們獲得贏家,您就可以立即發佈最吸引人的帖子。
最重要的是,您可以使用這些新見解來創建更相關的內容。以《今日美國》為例,平均 25% 提升 從使用社會 A/B。
3. 增加移動流量
去年,超過 70%的社會推薦 在 ShareThis 網路來自行動裝置。如果移動網站也是您的主要流量來源之一,那麼您就有機會讓行動讀者更輕鬆地進行社交共用。
這就是為什麼我們的共用按鈕是移動優化的。我們 share buttons 可以輕鬆自定義,在所有行動裝置上看起來都很棒。您甚至可以包括移動特定頻道的按鈕,例如 短信 和 WhatsApp.
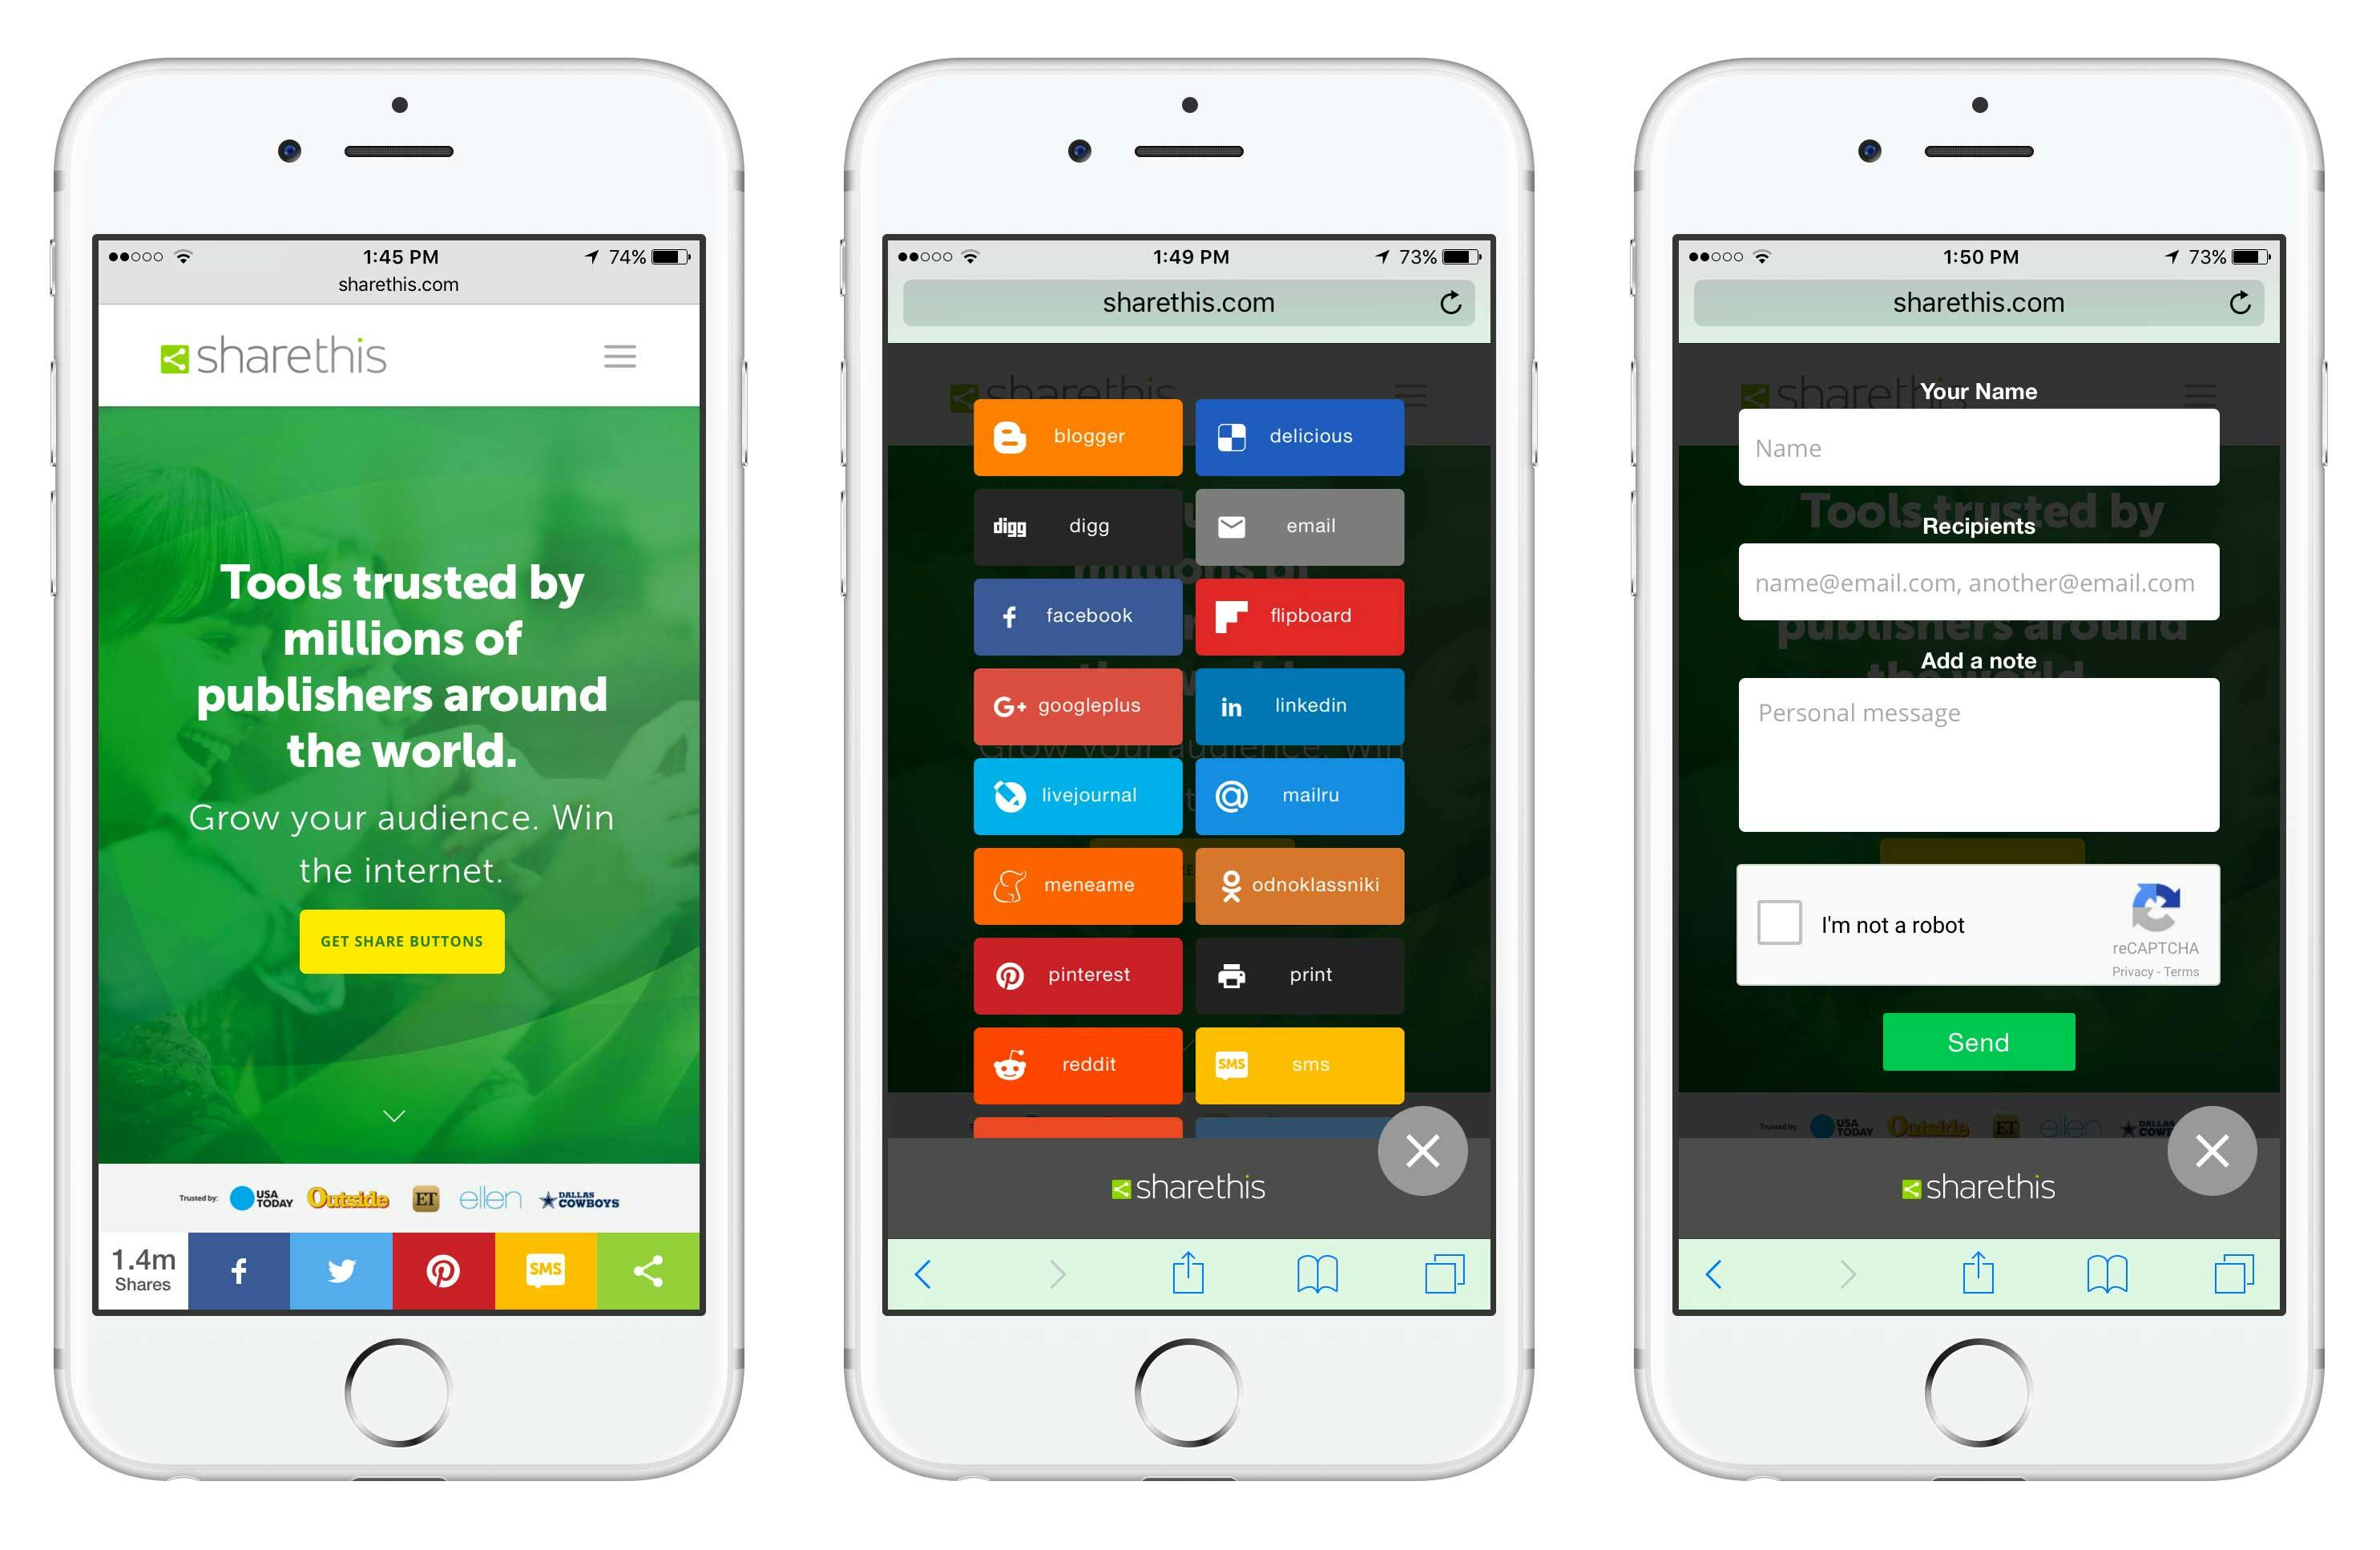
一旦你 自訂您的設計,您還可以查看移動預覽,以確保每個按鈕的外觀與您希望的完全一樣。
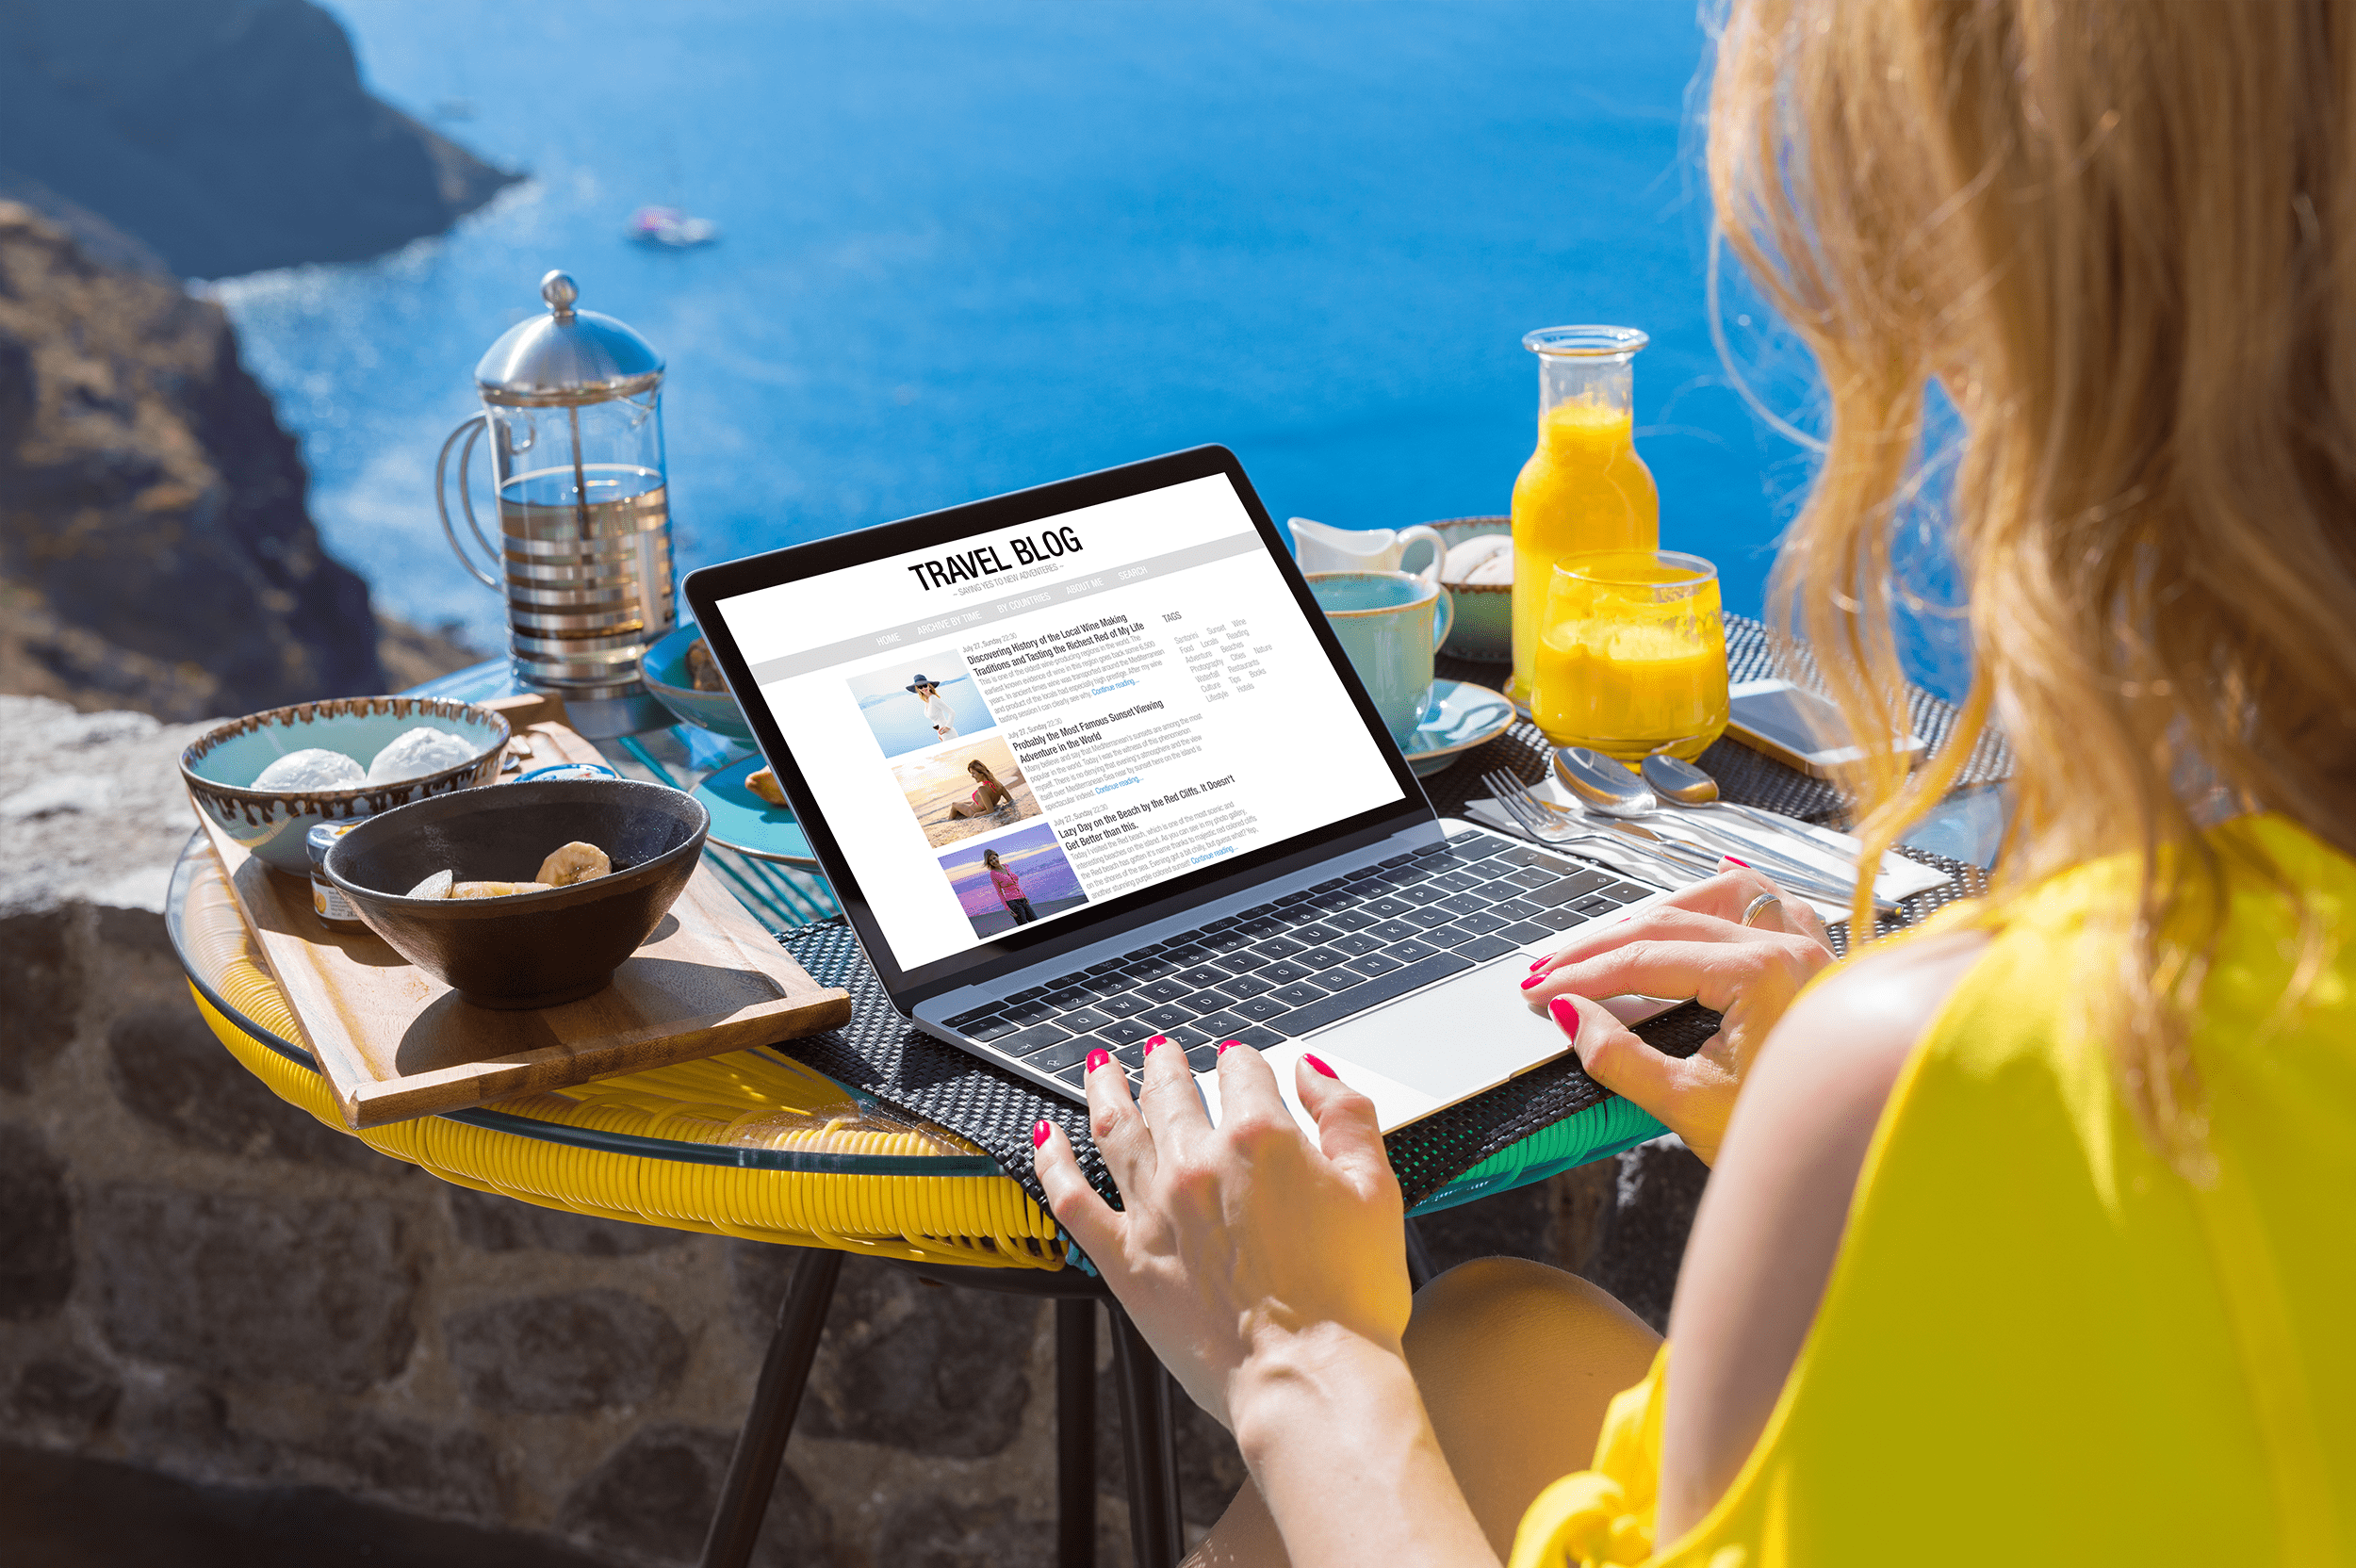
同樣,您的流量源報告可能看起來很簡單,但不要認為這是理所當然的。它充滿了重要的數據,您可以使用來增加你的讀者群,並授權你的觀眾分享他們最喜歡的社交管道。